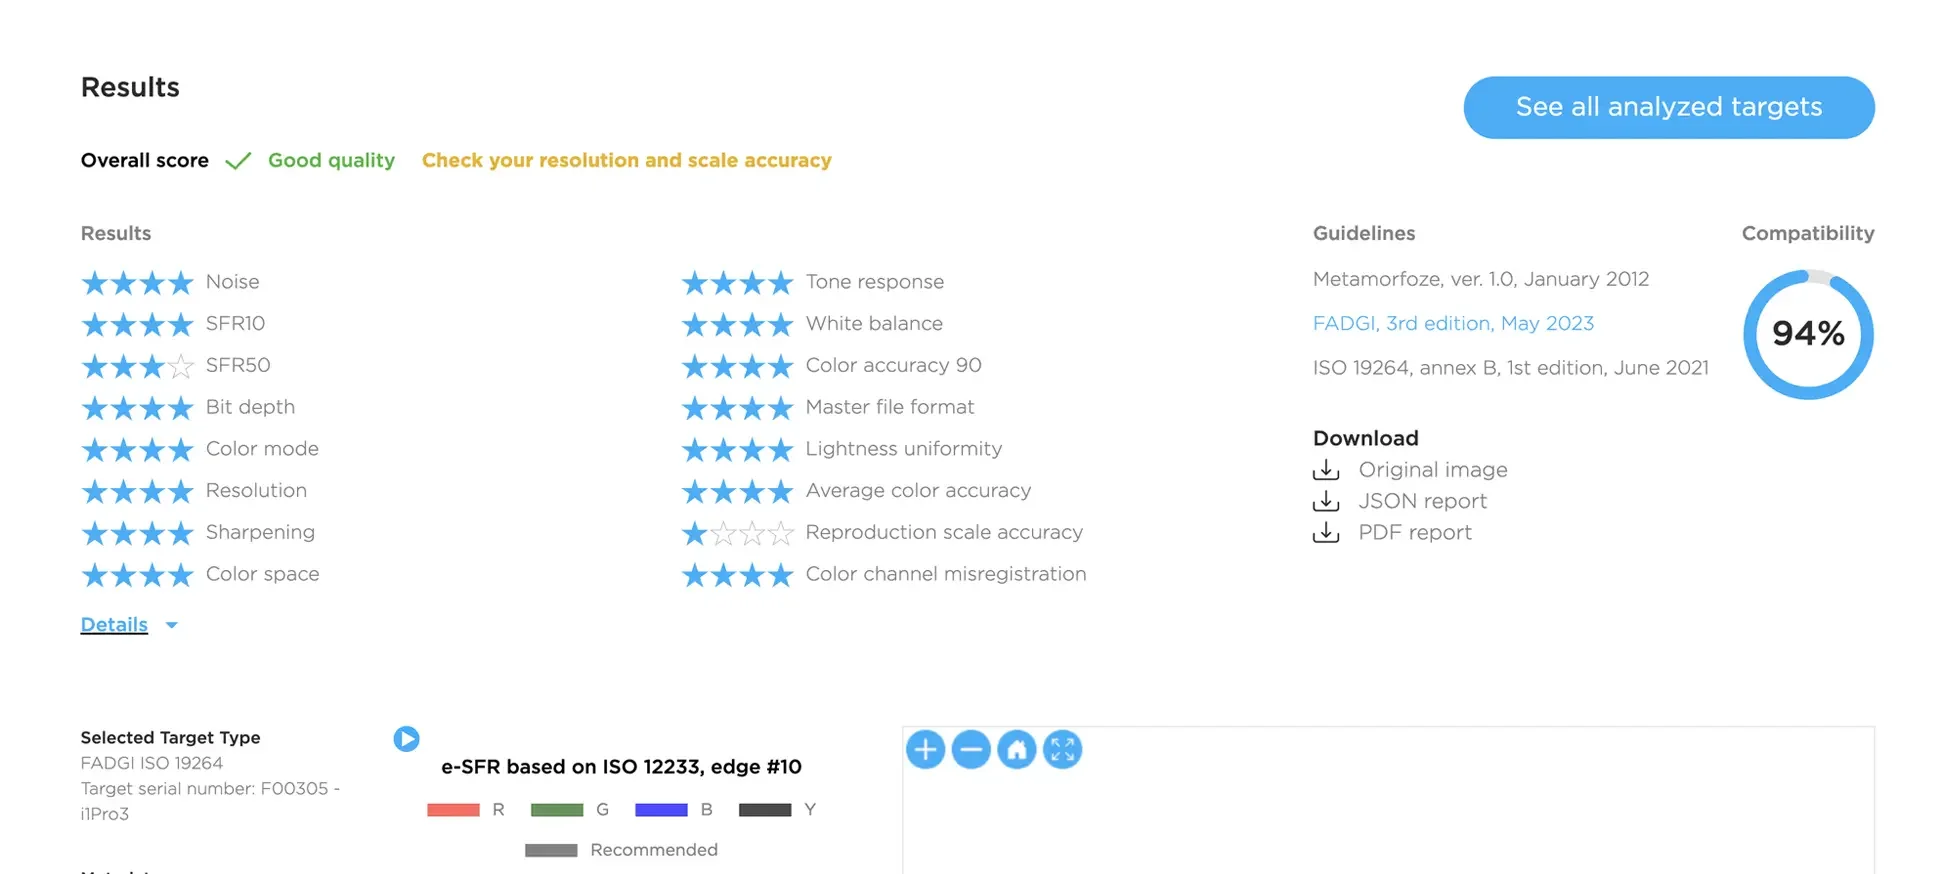
Results page showing analysis scores and quality indicators for a target image, including star ratings for noise, tone response, color accuracy, and other metrics, with a color target chart partially visible on the right side.

NimbusQA workflow

NimbusQA workflow is simple and effective. Requiring just a few steps, it returns deep insight into image quality, and ulitmate confidence in your digitization processes:

  • Purchase one of the supported reproduction targets e.g. Colorchecker SG

  • Measure your target (either created with a spectrometer or by downloading manufacturer data)

  • Photograph the target and export it to file - either .tif or .jpeg

  • Upload the measurements and the file to NimbusQA

  • NimbusQA will analyse the photo and compare with the measurements

  • Using one of 3 international standards, an objective image quality report is generated of how well your photograph matched the measurements

  • NimbusQA can measure from over a dozen parameters within the standards: Color accuracy, sharpness, scale accuracy, tone response and many more

  • Use the report to make corrective actions to improve quality, download the report to store alongside your digitisation project, or share the report with other stakeholders
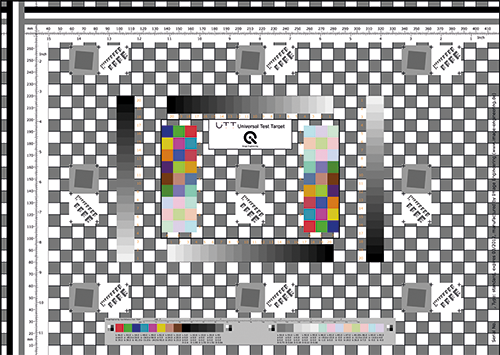
A checkerboard calibration chart used for camera testing, featuring two vertical color test strips, black and white borders, a gray scale, and measurement markings.
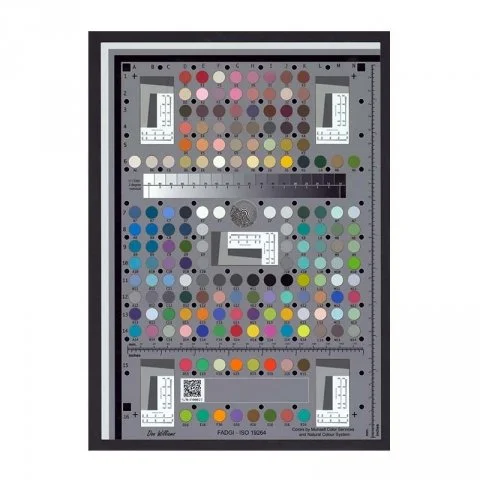
Color calibration chart with various color swatches, measurement markings, and calibration tools.

1. Physical Targets

Purchase one of the several targets we support.
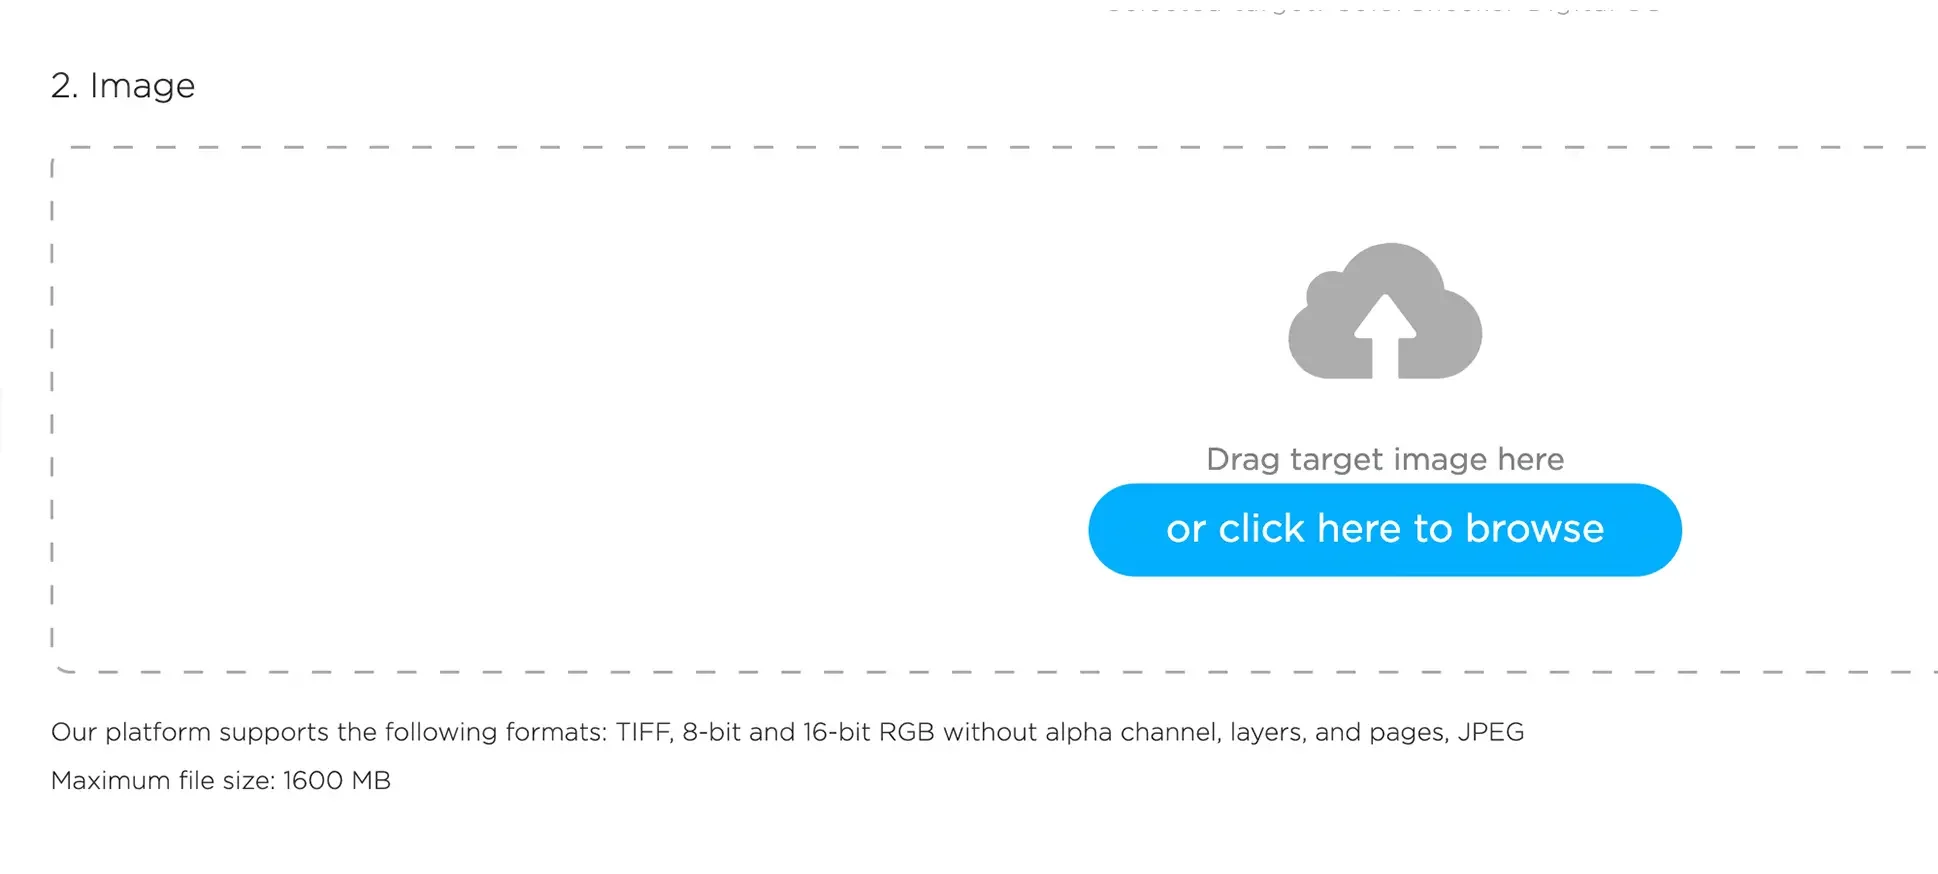
Cloud upload icon with arrow, text reading "Drag target image here" and a blue button labeled "or click here to browse". Underneath, informational text about supported image formats and maximum file size.

3. Guidelines

Choose the guidelines you want to measure against

2. Capture

Capture an image of the target under correct conditions
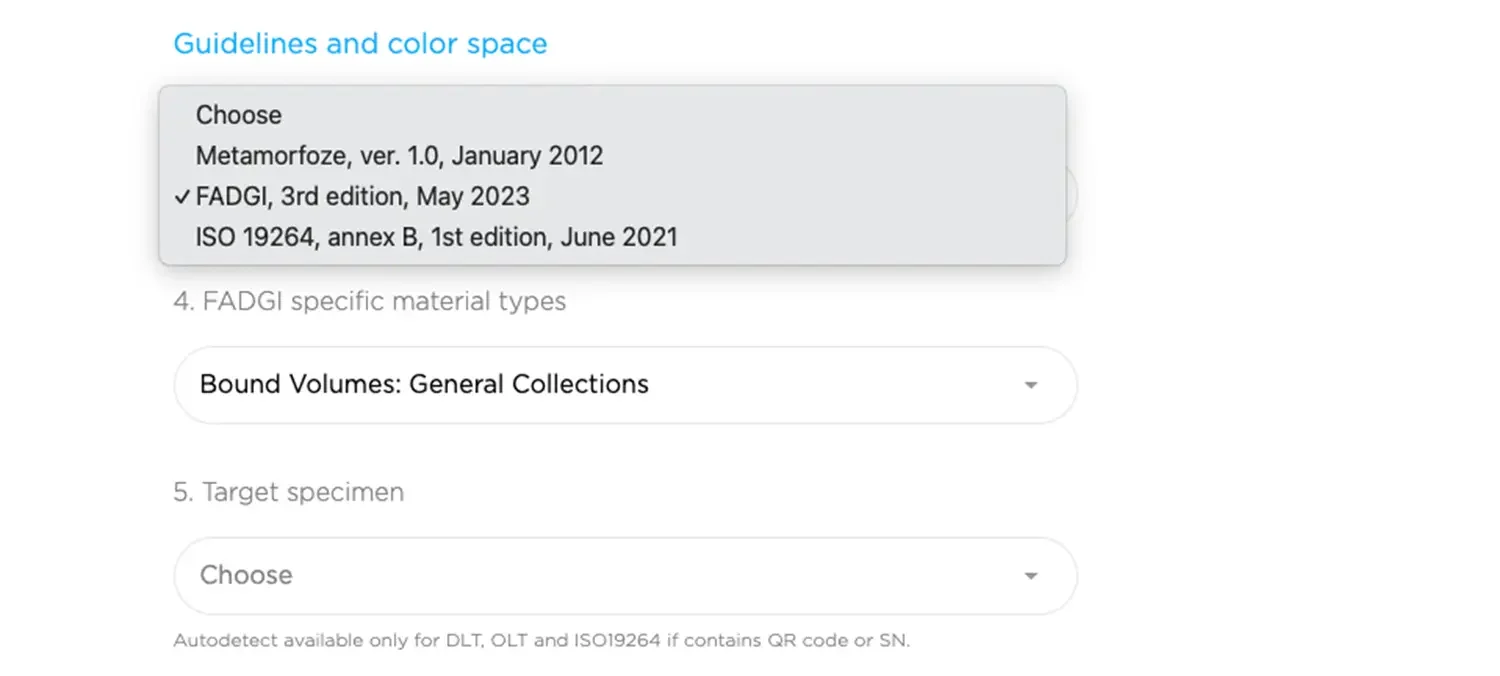
Screenshot of a software interface with a dropdown menu for selecting guidelines and color space options, showing choices for Metamorfose, FADGI, and ISO standards; the FADGI 3rd edition, May 2023 is selected.
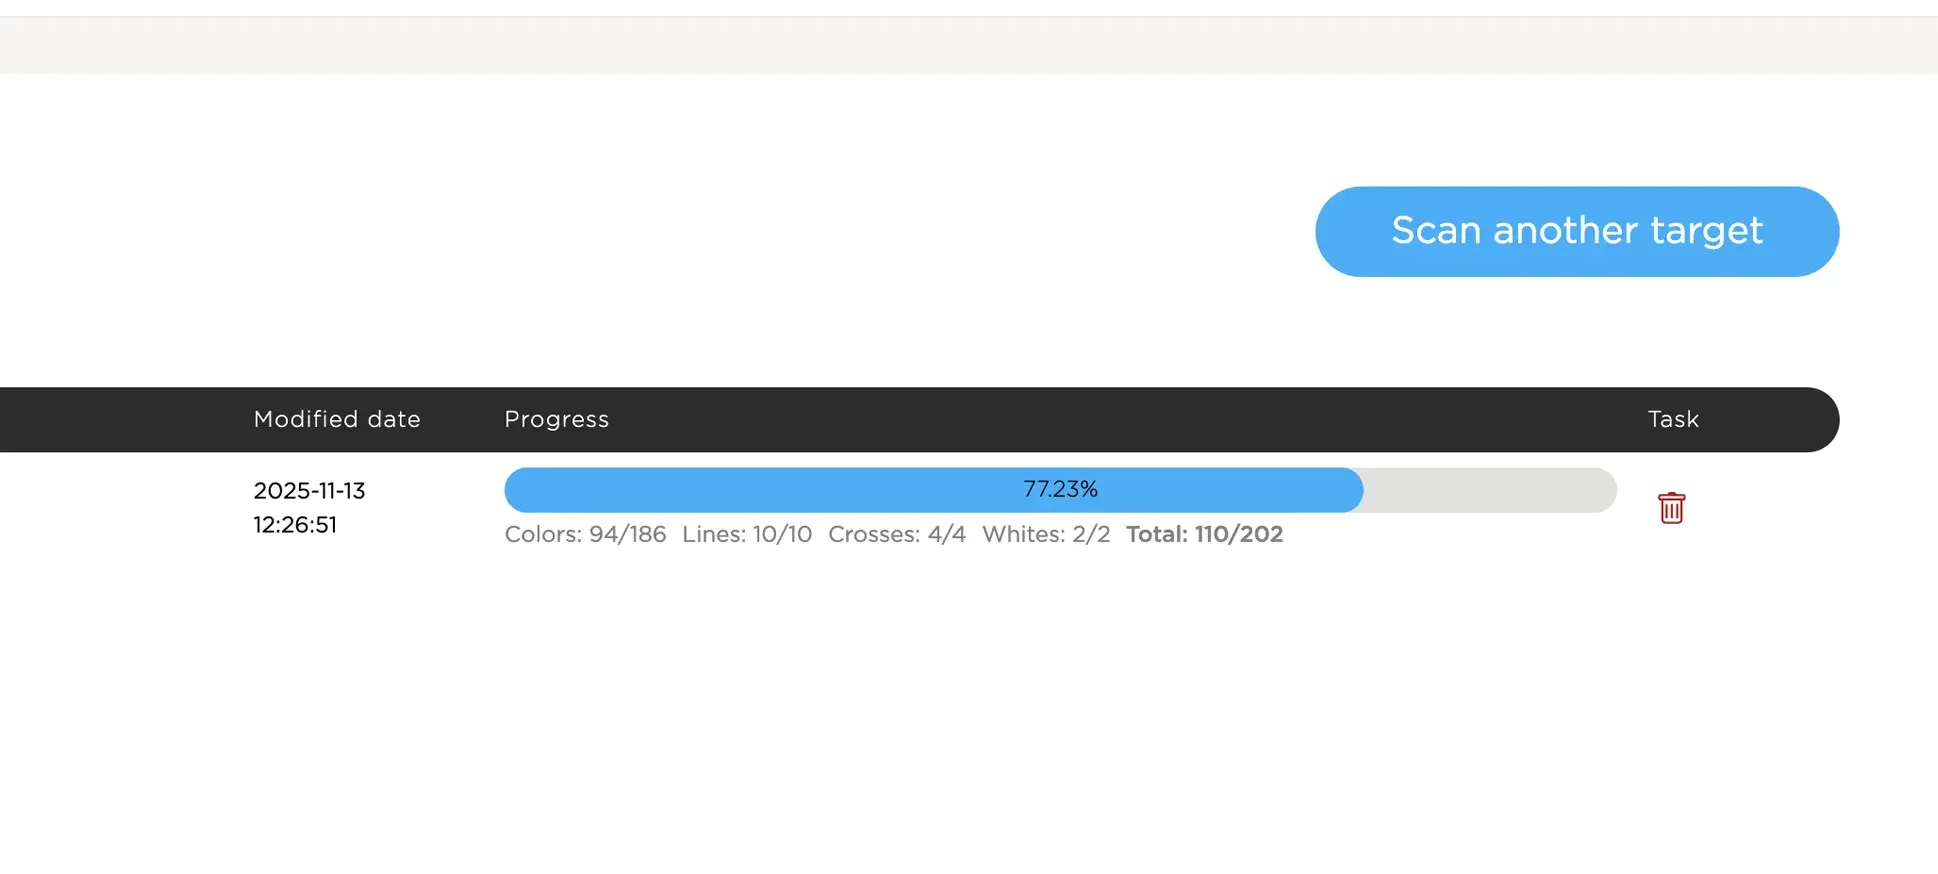
Screenshot of a user interface showing a progress bar at 77.23%, with a modified date of 2025-11-13 and time 12:26:51, and a task to scan another target, along with a trash bin icon for deletion.

4. Analyze

Analyze the image

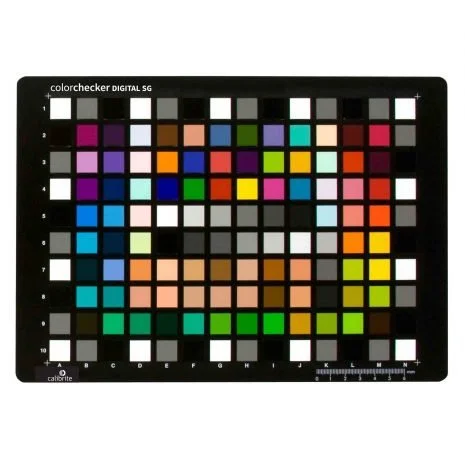
ColorChecker color calibration chart with various colored squares arranged in a grid on a black background.
Screenshot of a print quality analysis report showing ratings for noise, tone response, white balance, color accuracy, bit depth, color mode, resolution, sharpening, color space, and other metrics, with options to download reports.

5. Analysis & Data

Review your data… how’d you do?
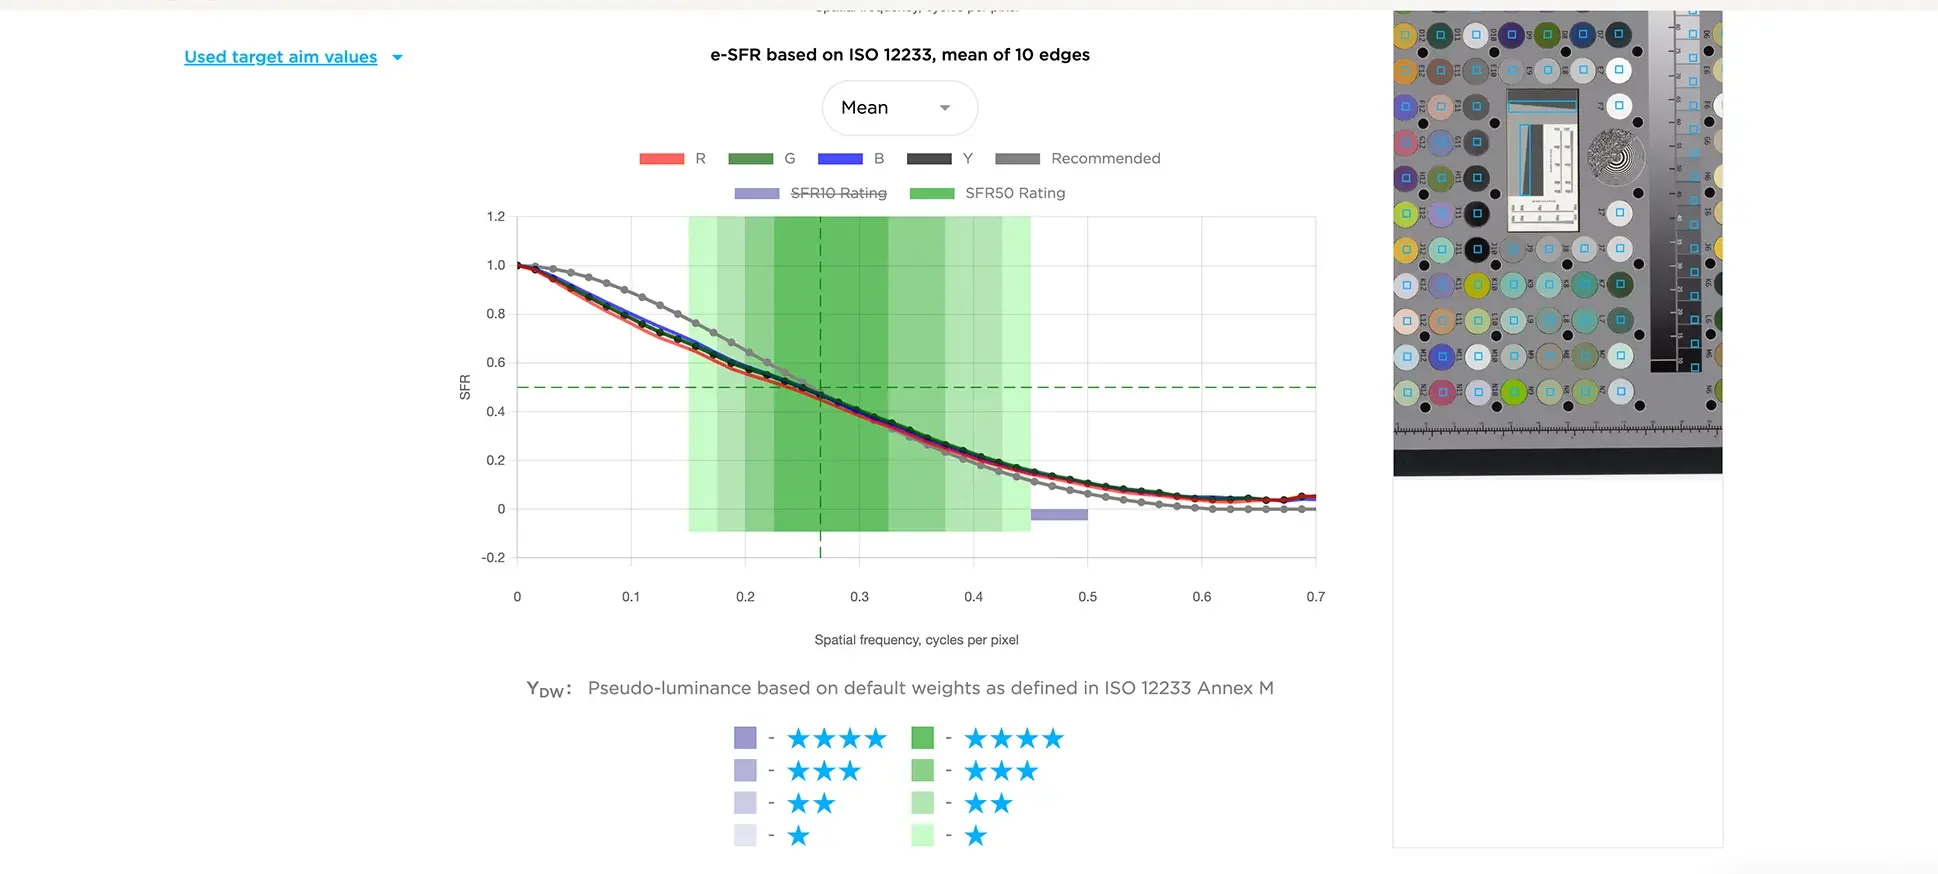
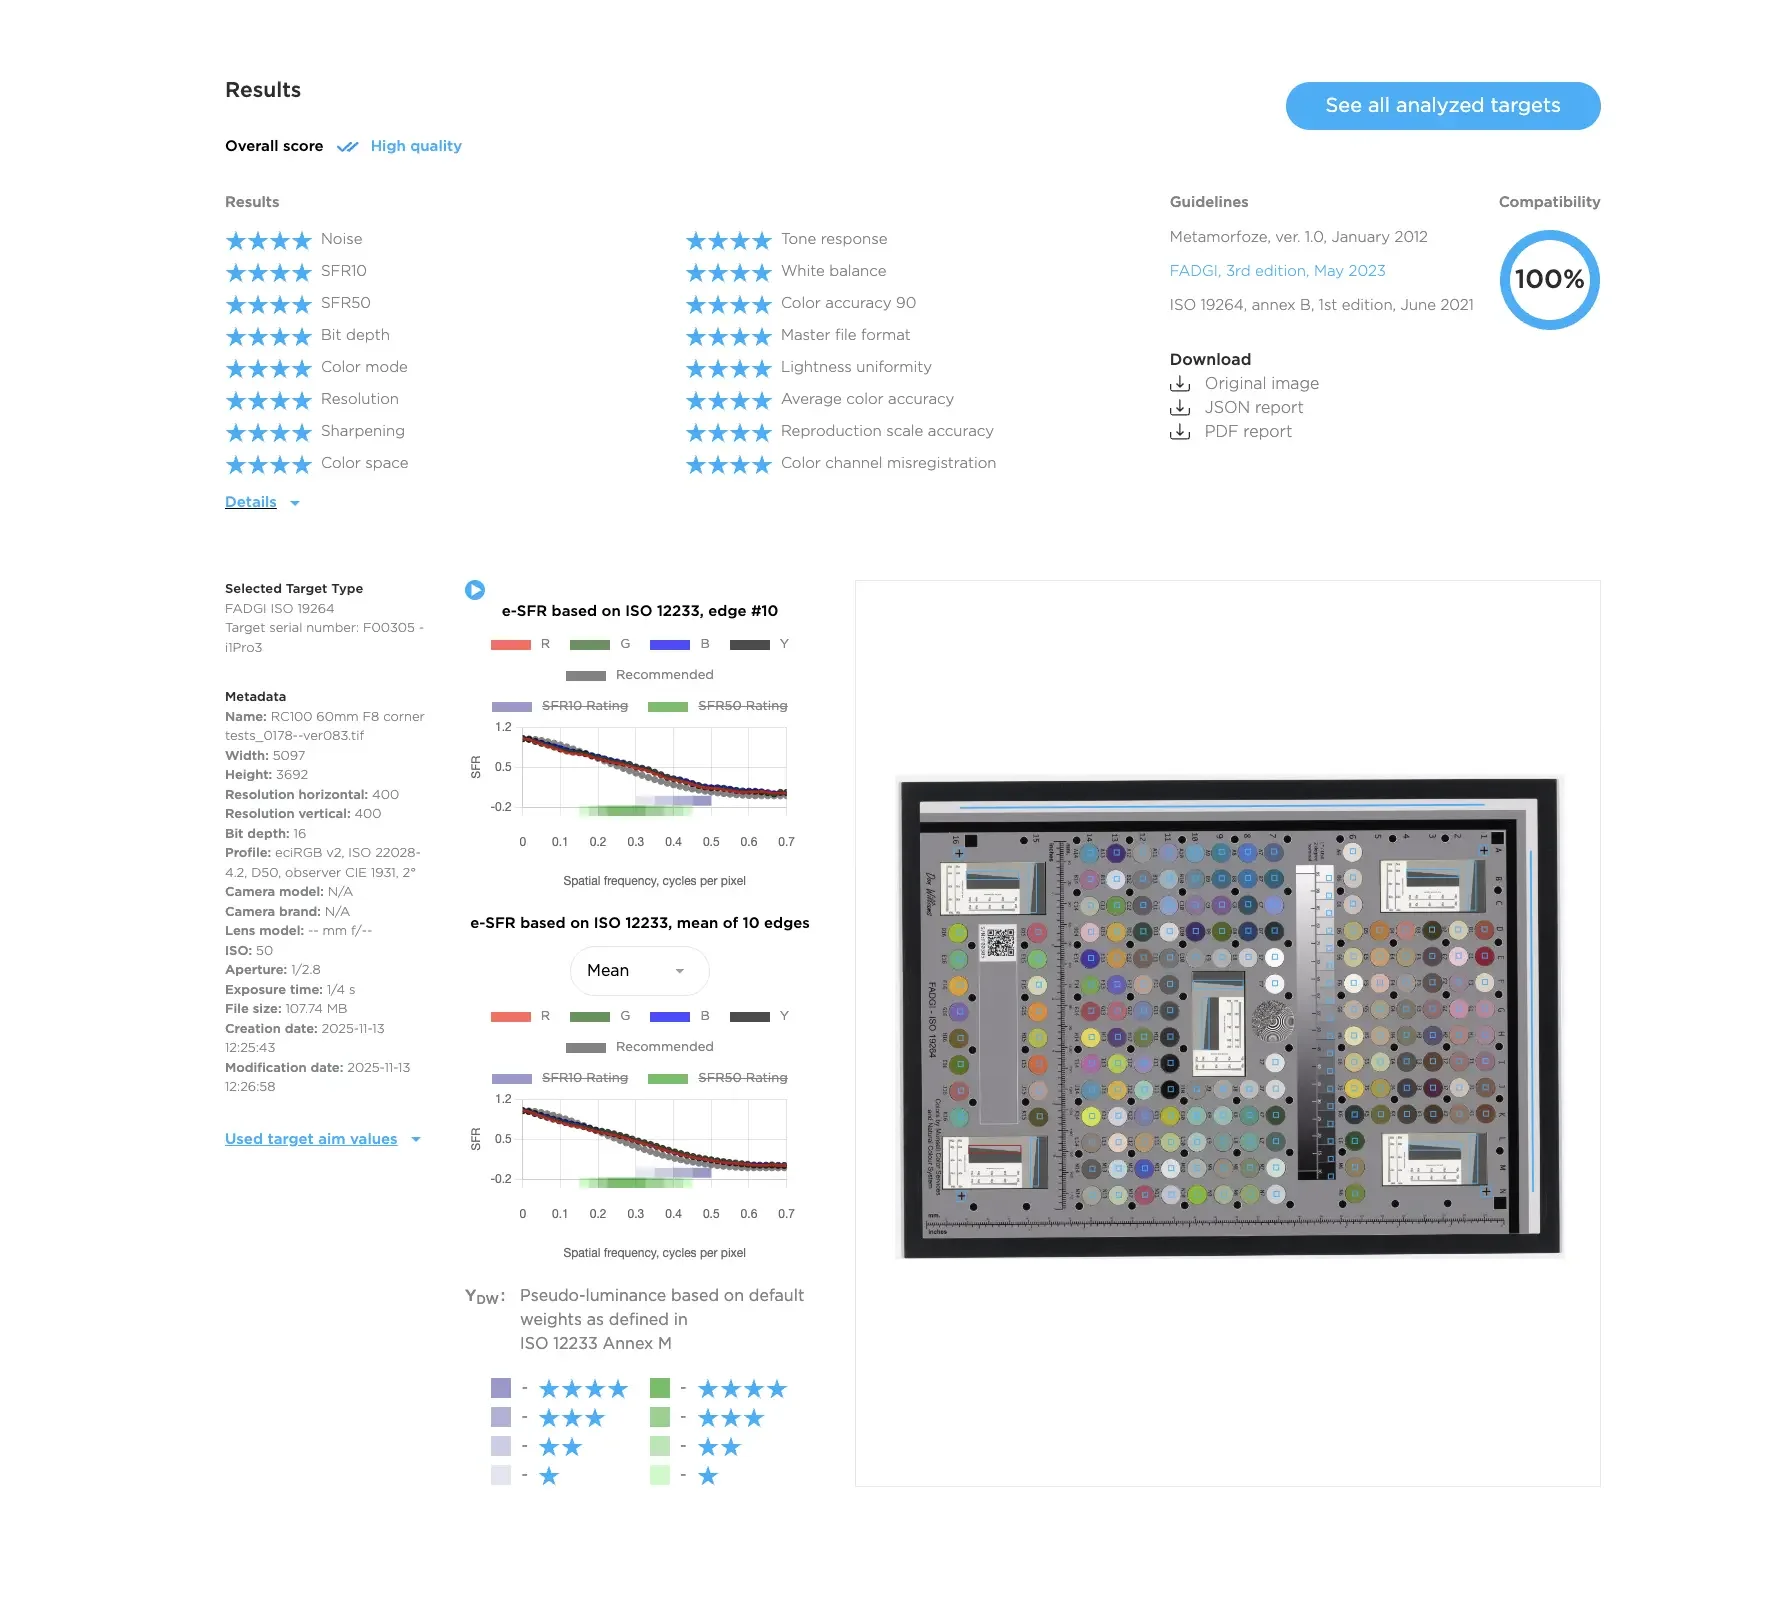
A graph shows the e-SFR based on ISO 12233, with a color-coded rating scale and mean of 10 edges. The graph plots SpatFreq versus SFR, with lines representing R, G, B, Y, and recommended ratings. To the right, there's an ISO target chart with color circles, squares, and measurement markings.

6. Details & Reports

Now you have all the details… what should you do now?